Official statistics from Finland, Denmark, Italy, and the Netherlands show that immigration outcomes are not uniform. When examined by immigrants’ country or region of origin, large and consistent differences appear in criminal involvement and net contributions to public finances. These patterns hold across multiple countries, crime categories, and time periods. Public attitudes, meanwhile, do not always track the data.
Political Attitudes in Finland
In Finland, support for parties with differing stances on immigration splits along gender lines. The Finns Party, which has taken a more restrictive position, draws 26% support among men but only 14% among women. The Greens, associated with more open policies, receive 10% support from women and 4% from men.
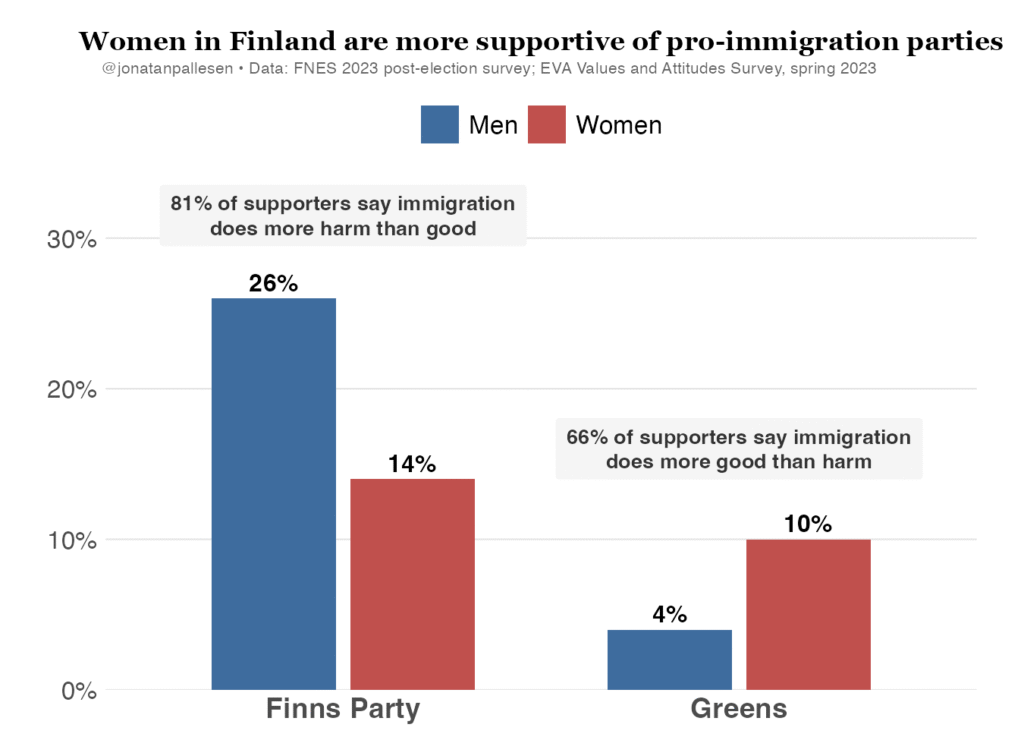
Among supporters of the more restrictive party, 81% say immigration does more harm than good. Among supporters of the more open party, 66% say it does more good than harm. These attitude differences set the stage for examining whether measurable outcomes align with public perceptions.
Crime Patterns by Country of Origin
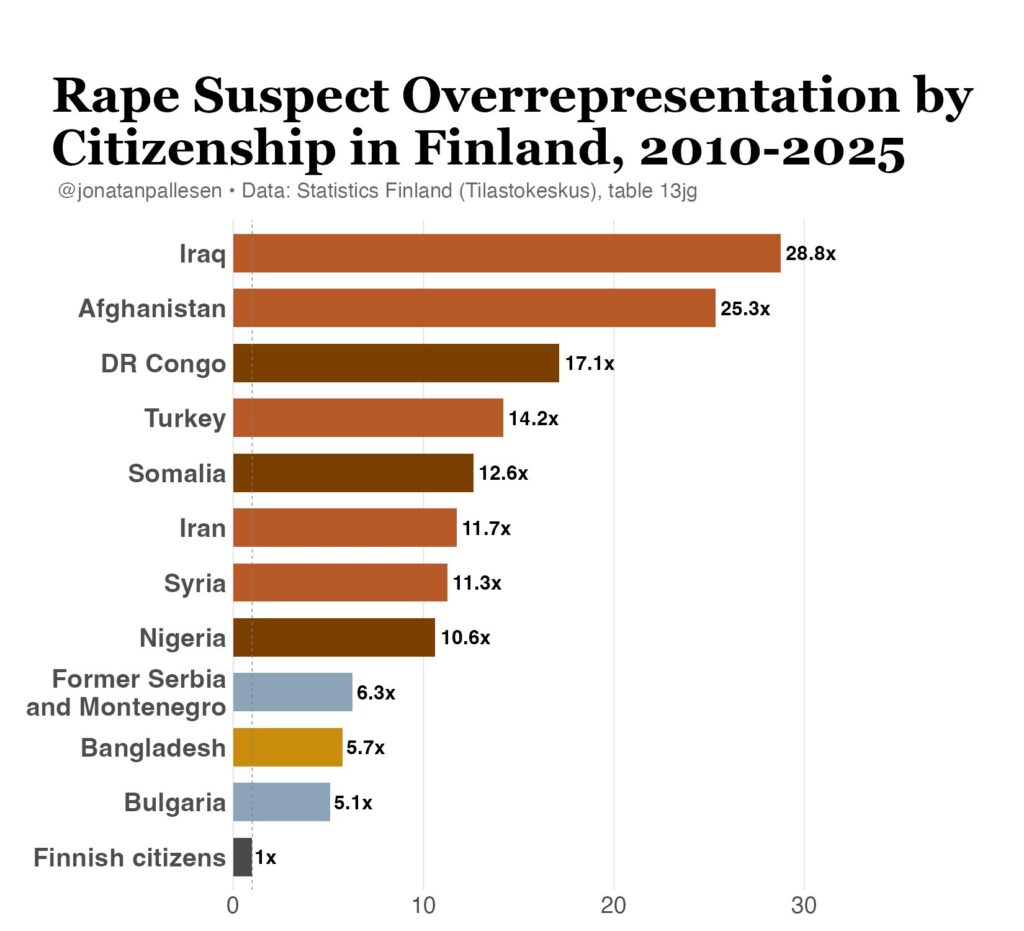
Government data reveal stark over-representation in crime for immigrants from certain origins.
In Finland, rape suspect rates relative to Finnish citizens show Iraq at 28.8 times, Afghanistan at 25.3 times, the Democratic Republic of Congo at 17.1 times, Turkey at 14.2 times, Somalia at 12.6 times, Iran at 11.7 times, Syria at 11.3 times, and Nigeria at 10.6 times. Finnish citizens serve as the 1× baseline.
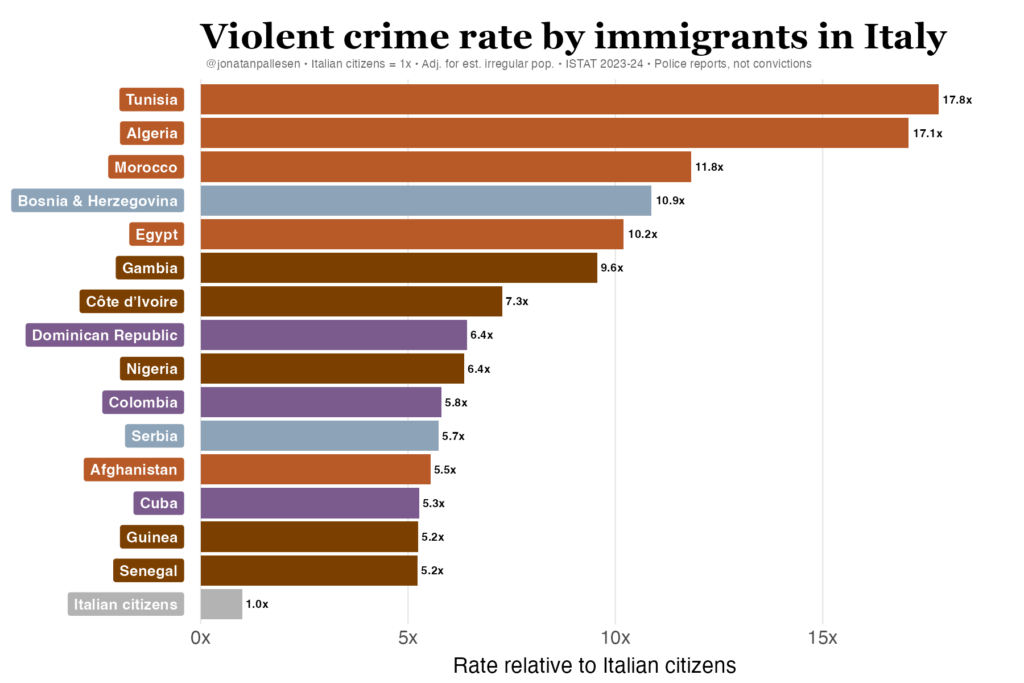
Italy reports similar disparities in violent crime rates (adjusted for estimated irregular population). Tunisia stands at 17.8 times the rate for Italian citizens, Algeria at 17.1 times, Morocco at 11.8 times, Bosnia and Herzegovina at 10.9 times, Egypt at 10.2 times, and Gambia at 9.6 times.
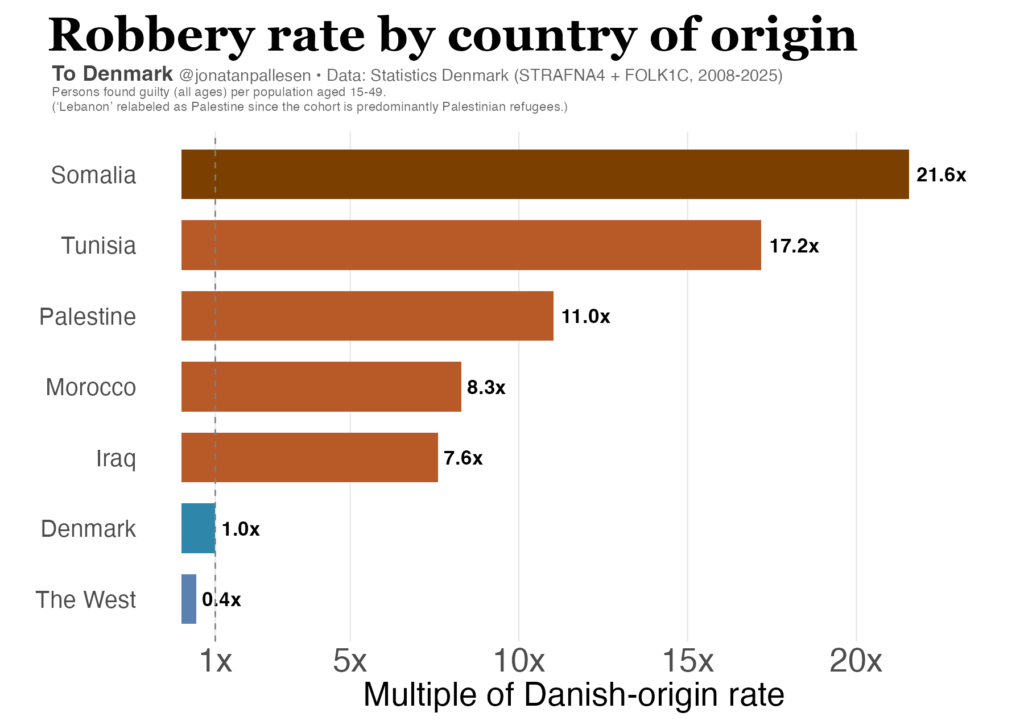
Denmark data on robbery (persons found guilty, ages 15–49) show Somalia at 21.6 times the Danish-origin rate, Tunisia at 17.2 times, Palestine at 11.0 times, Morocco at 8.3 times, and Iraq at 7.6 times.
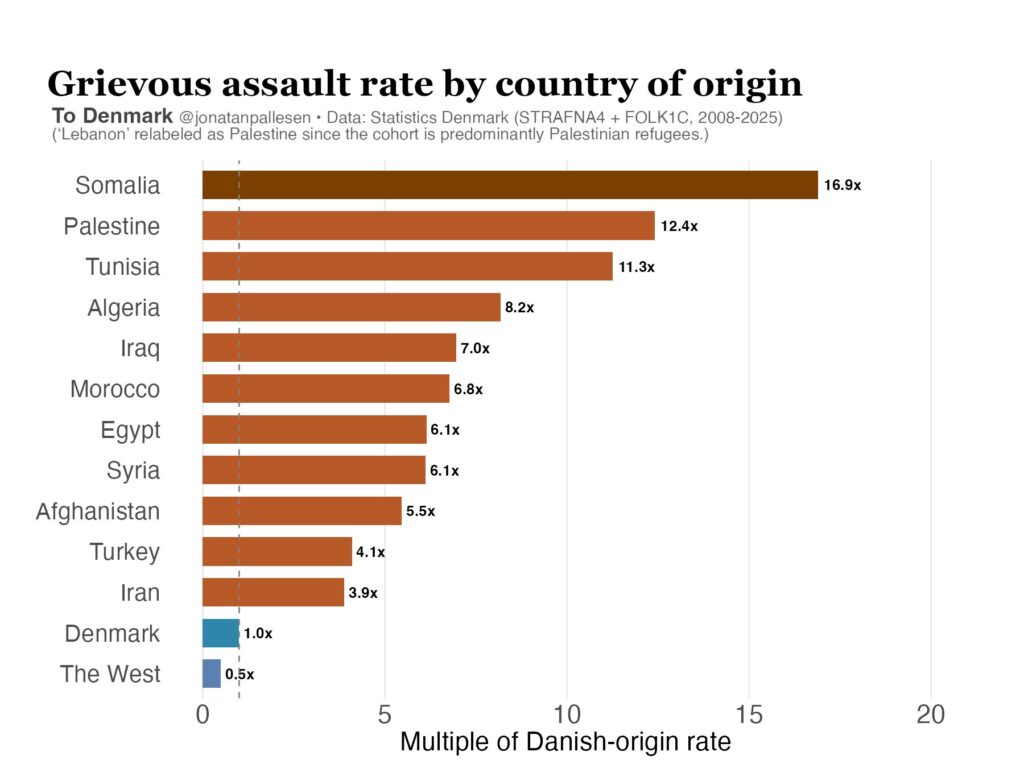
Grievous assault rates in Denmark follow a comparable ordering: Somalia at 16.9 times, Palestine at 12.4 times, Tunisia at 11.3 times, Algeria at 8.2 times, Iraq at 7.0 times, and Morocco at 6.8 times.
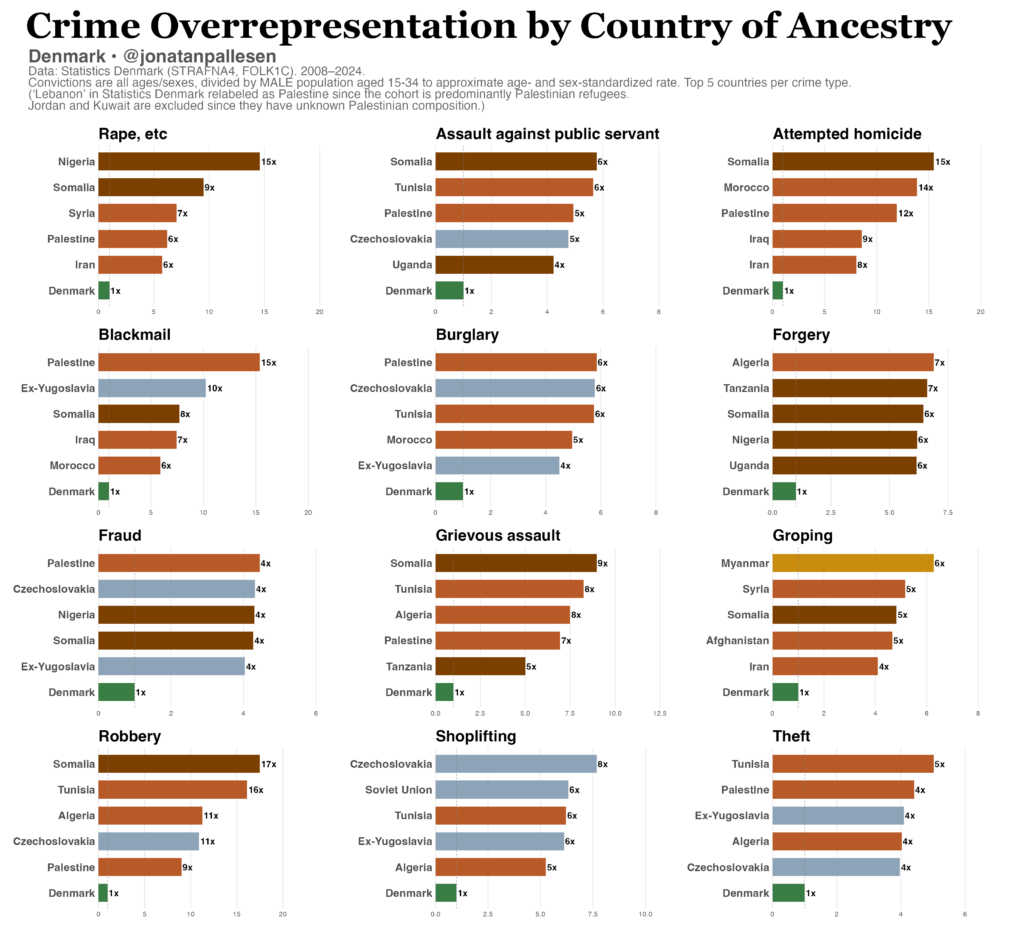
A broader analysis of convictions in Denmark (2008–2024, age- and sex-standardized) across multiple crime types—rape, assault against public servants, attempted homicide, blackmail, burglary, forgery, fraud, grievous assault, groping, robbery, shoplifting, and theft—places the same countries repeatedly at the top. Somalia, Palestine, Tunisia, Algeria, Iraq, Morocco, and Nigeria feature prominently across categories, while Danish-origin and many Western European groups cluster near the 1× baseline.
A summary violent crime rate chart for Denmark (ages 15–79) reinforces the pattern. Somalia reaches 9.4 times the Danish-origin rate, Lebanon 8.3 times, Palestine 8.2 times, and Tunisia 8.1 times. Many Western European countries and some Eastern European ones fall at or below the baseline.
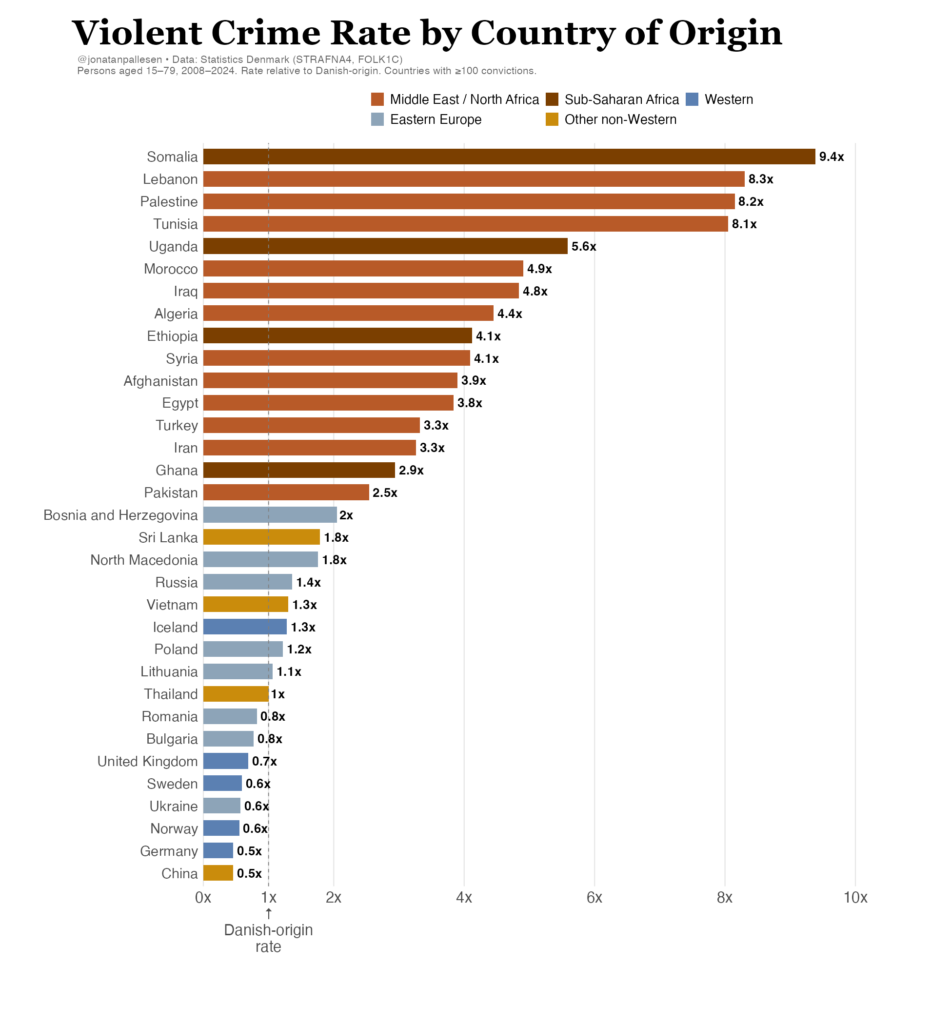
These figures come from police reports, convictions, and suspect data compiled by national statistical agencies. Relative rates control for population size and, in several cases, age and sex.
Fiscal and Economic Impacts
Fiscal outcomes also vary sharply by origin.
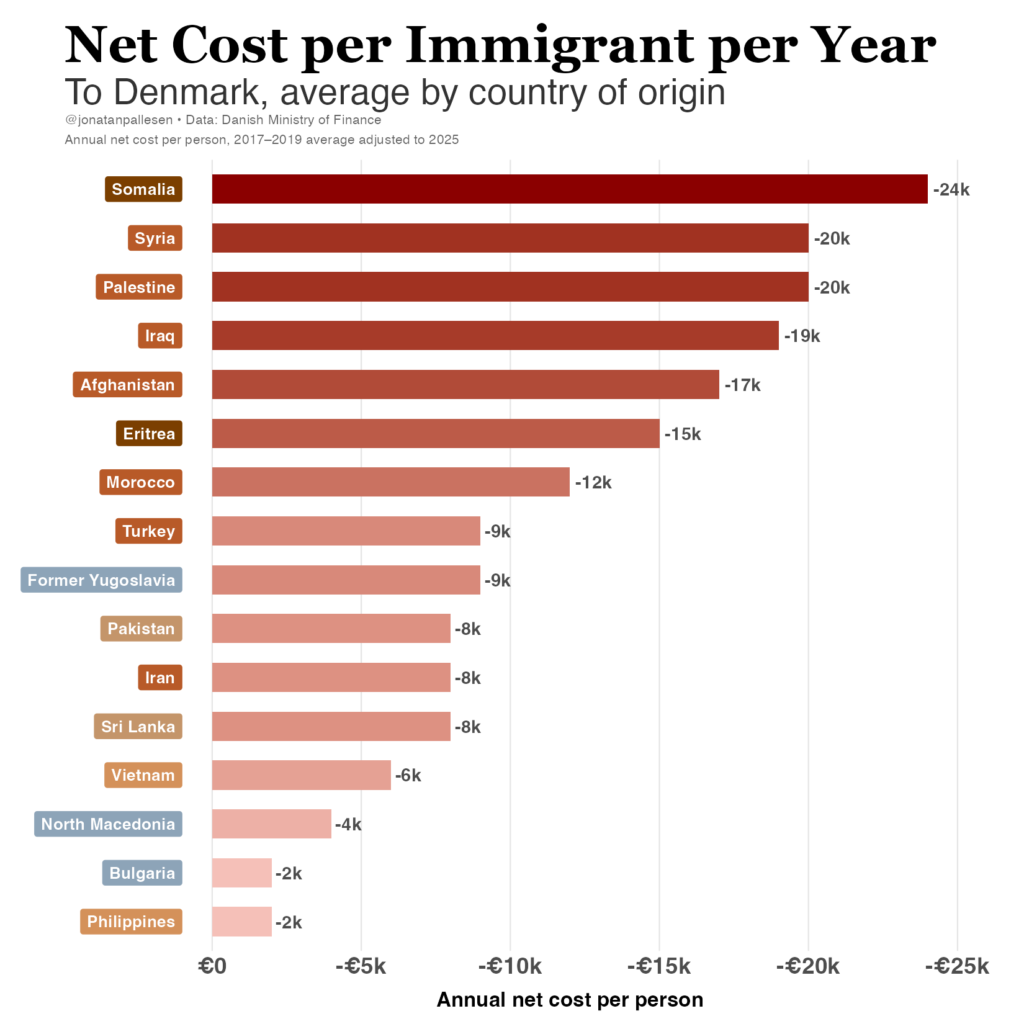
In Denmark, average annual net cost per immigrant (2017–2019 average, adjusted to 2025) shows Somalia at a net cost of €24,000 per person, Syria and Palestine at €20,000 each, Iraq at €19,000, Afghanistan at €17,000, Eritrea at €15,000, and Morocco at €12,000. Several other non-Western origins carry net costs between €4,000 and €9,000. Some origins from Eastern Europe and Asia show smaller costs or net contributions.
An age-profile analysis of net contribution to public finances in Denmark illustrates lifetime trajectories. Danish-origin individuals and other Western immigrants generate positive net contributions during working ages before declining in retirement. Groups from the Middle East, North Africa, Pakistan, and Turkey (MENAPT) and other non-Western categories remain net negative across most adult ages.
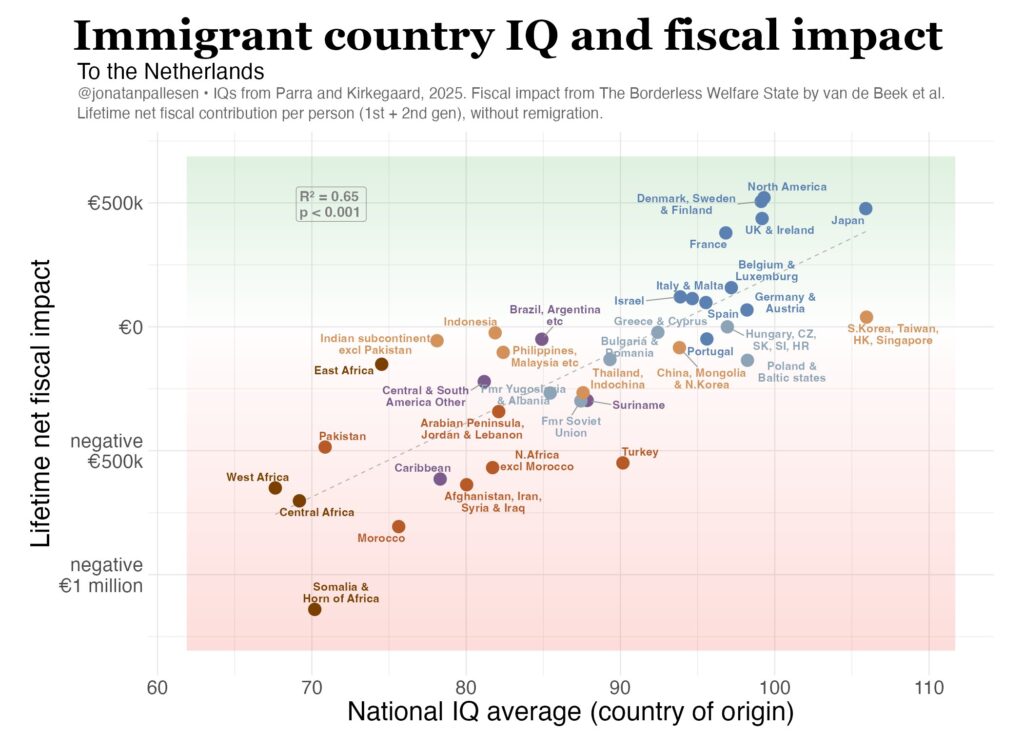
In the Netherlands, lifetime net fiscal contribution (first and second generation, without remigration) correlates strongly with national IQ averages of the immigrants’ countries of origin (R² = 0.65). Higher average IQ source countries cluster toward positive lifetime contributions; lower average IQ source countries cluster toward large negative contributions.
Correlations Between Crime and Fiscal Costs
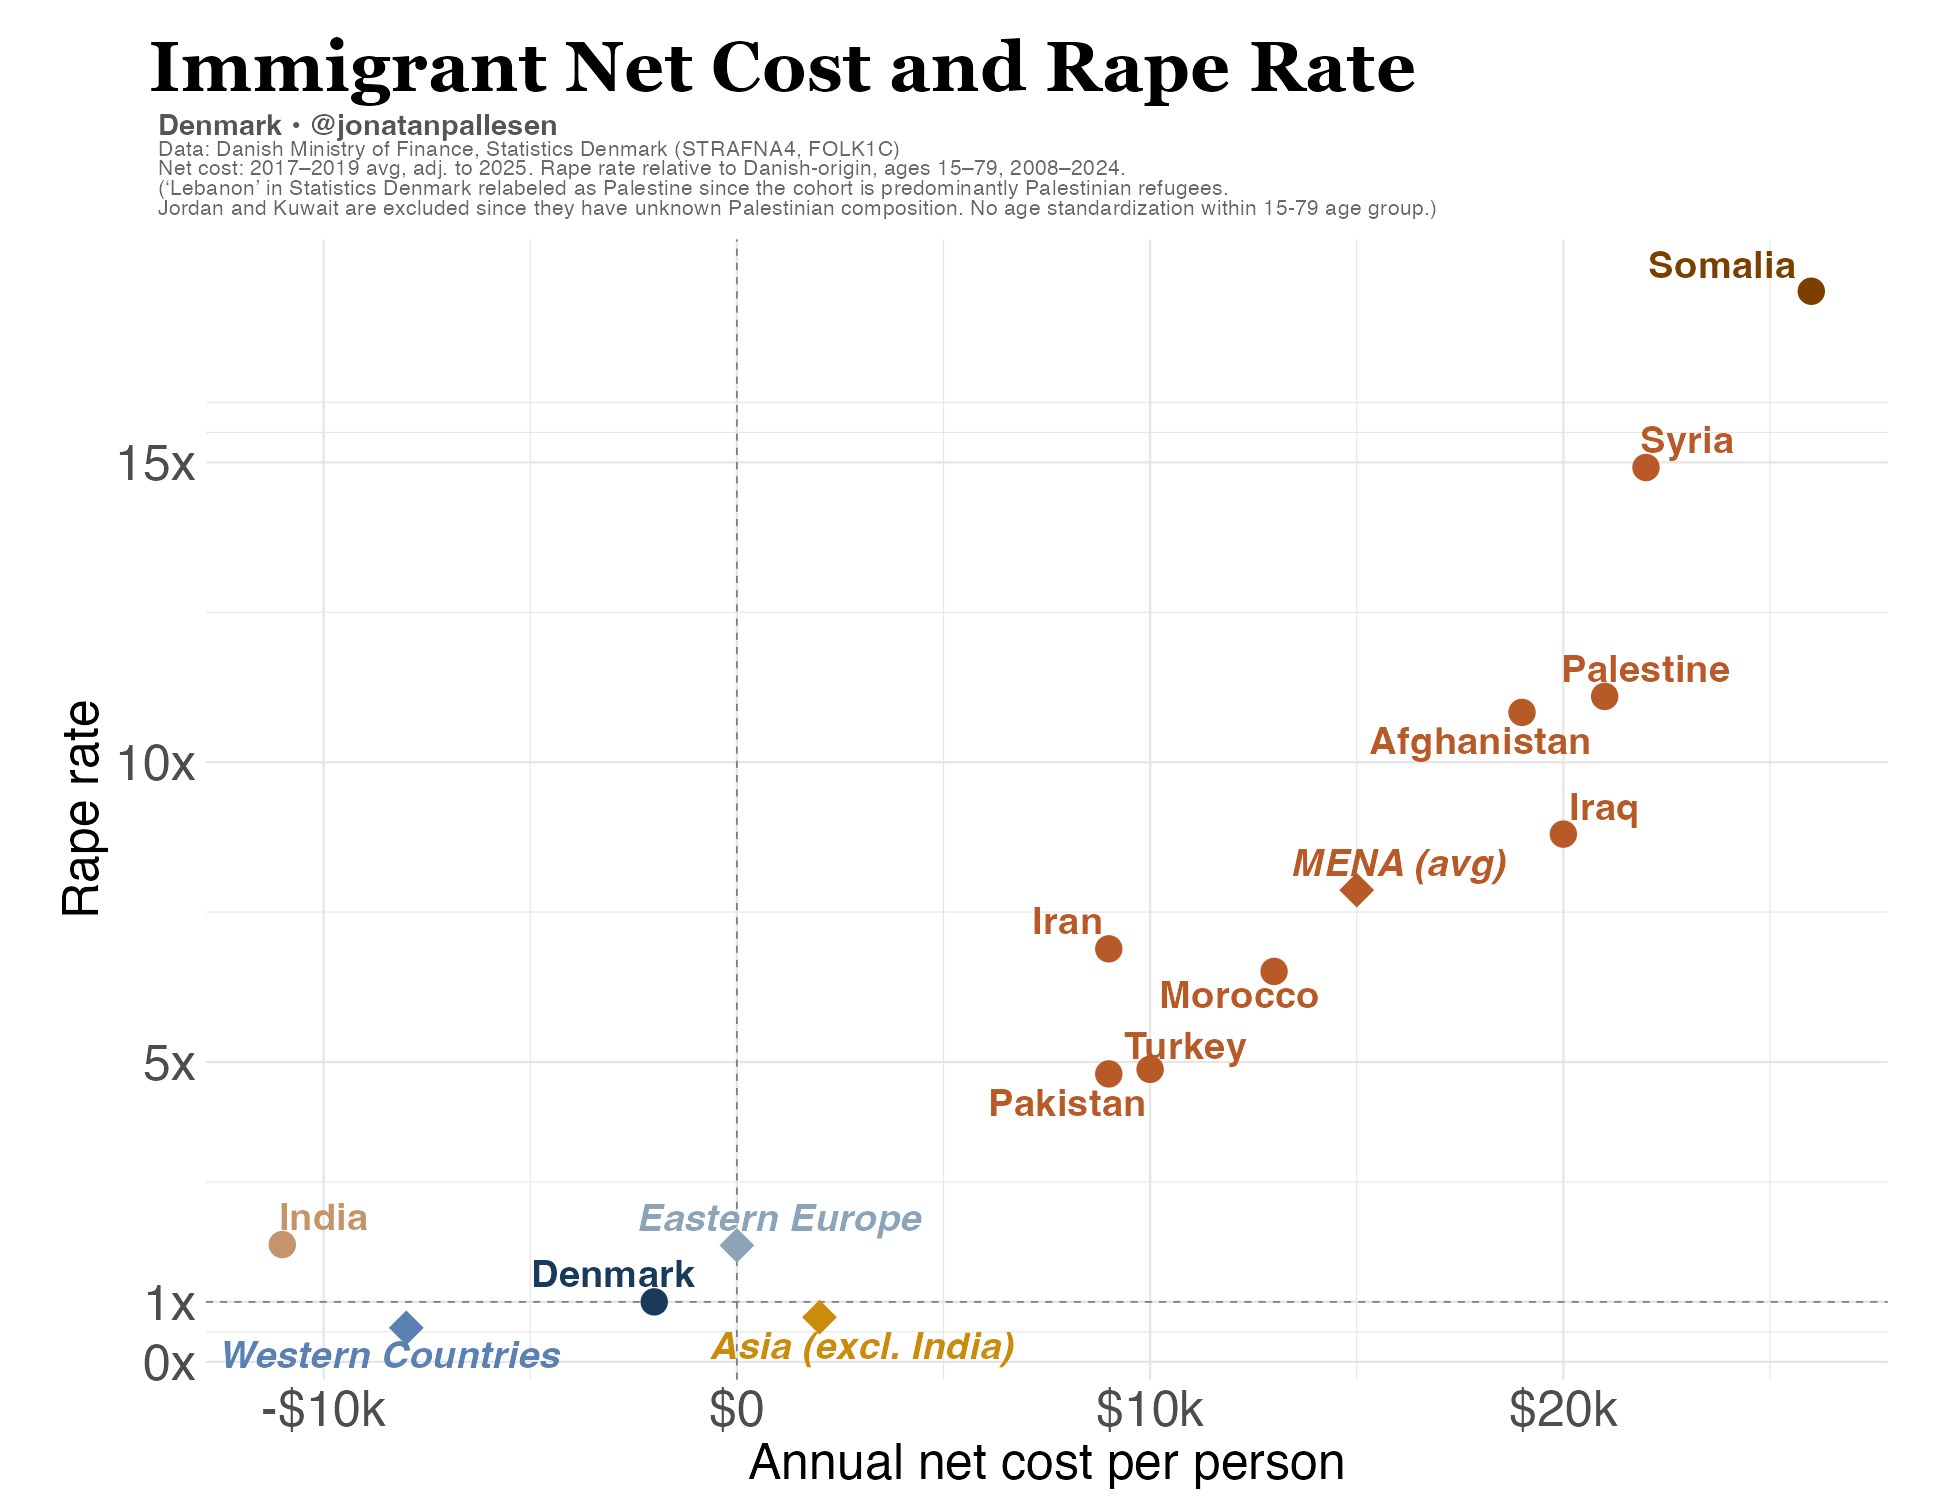
Two scatter plots from Danish data directly link the crime and cost dimensions.
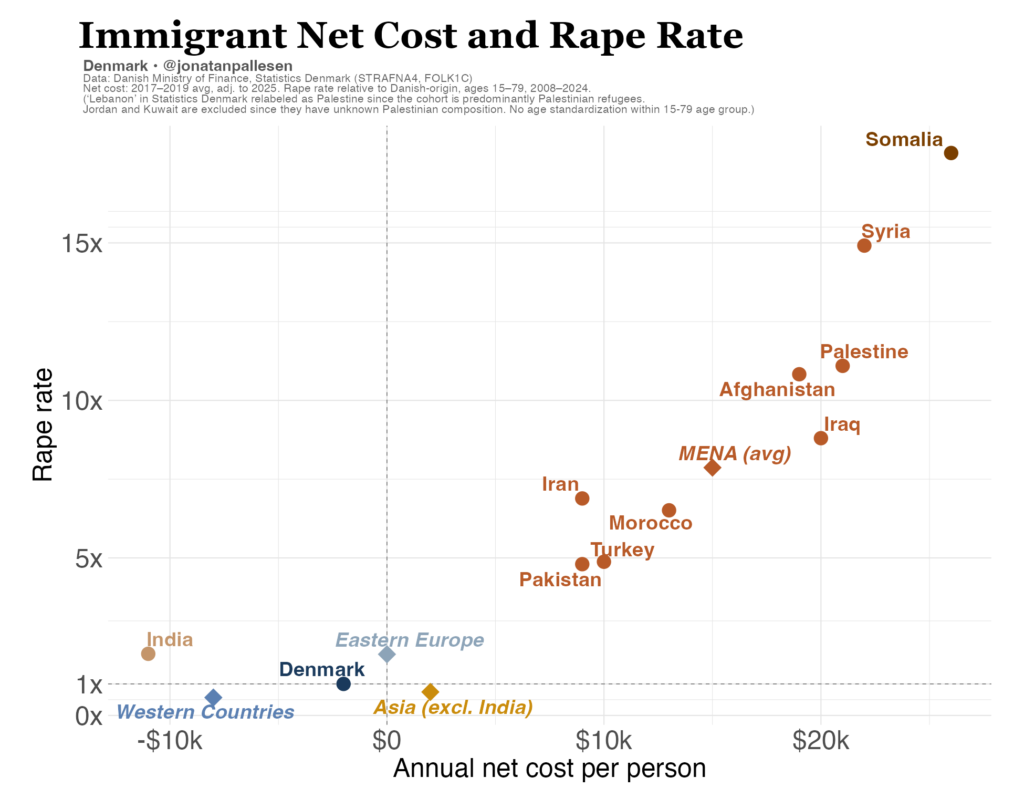
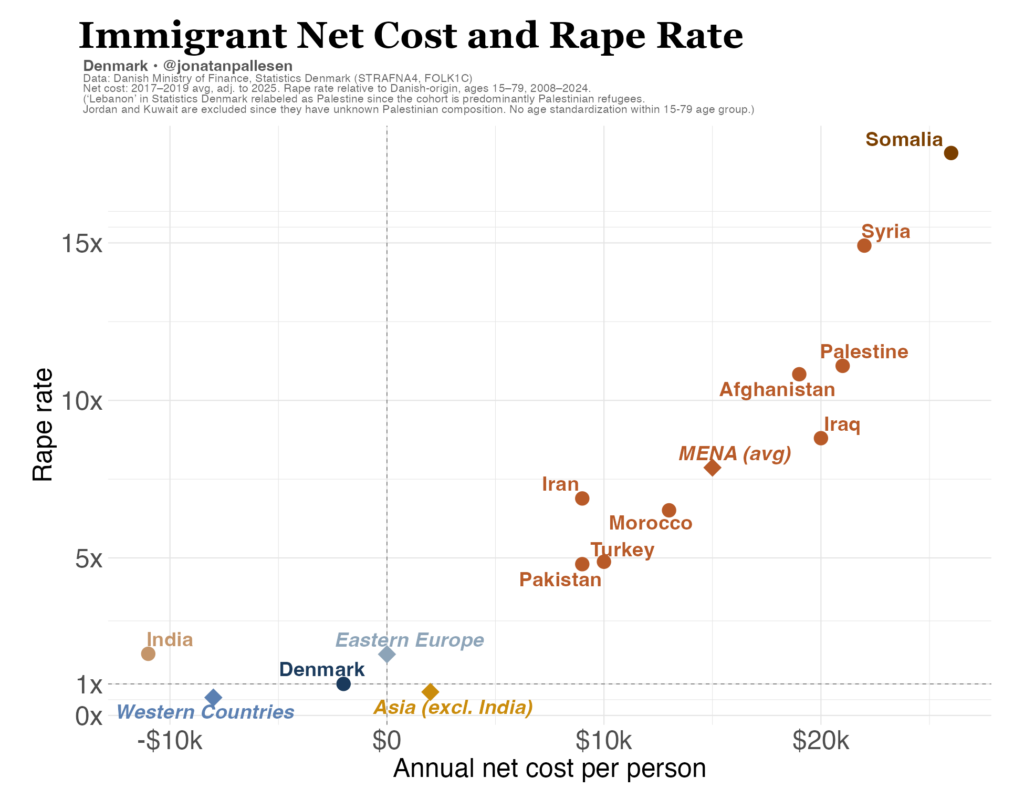
One plots annual net fiscal cost against rape rate multiples (relative to Danish-origin, ages 15–79). Origins with the highest net costs sit on the right side of the chart and show the highest rape-rate over-representation. Somalia, Syria, Palestine, Afghanistan, and Iraq appear in the upper-right quadrant.
A parallel plot for severe violence rates shows the same clustering: higher net fiscal costs align with higher violence-rate multiples.
These correlations indicate that the origins driving elevated crime statistics are largely the same ones driving the largest per-person fiscal drains.
Discussion
The patterns are consistent across datasets. Countries in the Middle East and North Africa, along with Somalia and a few others in Sub-Saharan Africa, appear repeatedly at the high end of both crime over-representation and net fiscal costs. Western European origins and Danish/Finnish/Italian natives sit near baseline on crime and closer to break-even or positive on fiscal measures. Eastern European and some Asian origins fall in between.
The data come from official sources: Statistics Finland, Statistics Denmark, ISTAT (Italy), and Dutch fiscal studies. Many charts adjust for population denominators, age, and sex where relevant. Relative rates (multiples of the native baseline) make direct comparisons possible despite differing absolute levels across countries.
National IQ averages of origin countries correlate with fiscal outcomes, consistent with broader research on human capital and productivity. Crime disparities align with differences in cultural, educational, and selection factors that also influence economic integration.
Public opinion, as captured in the Finnish party-support split, shows a gender gap. Women lean toward parties with more open immigration positions, while men show relatively stronger support for more restrictive ones. The statistical patterns documented here do not automatically dictate any single policy response, but they supply concrete information for evaluating trade-offs.
Conclusion
When immigration is disaggregated by country and region of origin, clear and replicable differences emerge in crime involvement and net fiscal impact. These differences appear in Finland, Denmark, and Italy using independent official statistics. They correlate internally: higher crime overrepresentation tracks with higher net costs. They also align with measurable human-capital indicators such as average IQ of source countries.
The visualizations synthesized here—from gender splits in political support, through detailed crime rankings, fiscal bar charts, age profiles, and scatter plots of cost versus crime—form a coherent dataset. Any policy framework that treats immigration as a single undifferentiated category will miss these origin-specific realities. Selective approaches that account for origin, skills, and integration prospects rest on firmer empirical ground than uniform openness or uniform restriction.
The evidence is public and drawn from government statistical agencies. Readers can examine the underlying tables for themselves.